Research project
Air-pollution innovation in regional-forecasts utilising operational satellite applications and technologies (AIRSAT)
- Start date: 1 January 2024
- End date: 31 December 2026
- Funder: NERC
- Value: £232,000
- Partners and collaborators: UK Met Office, Rutherford Appleton Laboratory
- Primary investigator: Dr Richard Pope
Deteriorating air quality (AQ) is an ongoing challenge for all major global economies and is now recognised as the largest environmental stress on human health. The effects are felt most acutely by those living in the world’s largest cities. In the UK, poor AQ results in ~40,000 premature deaths per year and costs the economy £8-20 billion annually. To help address this issue, the UK Met Office (UKMO) provides crucial national AQ forecasts using their air quality model (AQM). These forecasts simulate a range of key air pollutants such as nitrogen dioxide (NO2), ozone (O3) and aerosols, all of which can be observed from space and surface networks.
These forecasts are translated into a Daily AQ Index (DAQI) provided to the public via the Department of Environment, Food and Rural Affairs (Defra) website and various media platforms. At present, the UKMO evaluates the skill of its operational AQ forecasts using only surface monitoring sites (e.g. AURN – the Automated Urban and Rural Network) and calibrates the forecasts in a “statistical post-processing of observations (SPPO)” step based on the model-observation differences. However, given the strong variations in surface emissions and local meteorology, ground-based monitoring sites are often unrepresentative of widespread pollution.
Near-real time (NRT) satellite observations can be a valuable additional resource providing AQ monitoring from regional to national scales. Previous satellite instruments have had a relatively poor spatial resolution (e.g. 320 km × 40 km) but current and future instruments have greater horizontal resolutions (e.g. 3.5 km × 5.5 km) than many regional models (e.g. AQM). Therefore, NRT satellite products provide the exciting and timely opportunity to evaluate and improve national AQ forecasts for the benefit of the public and down-stream stakeholders.
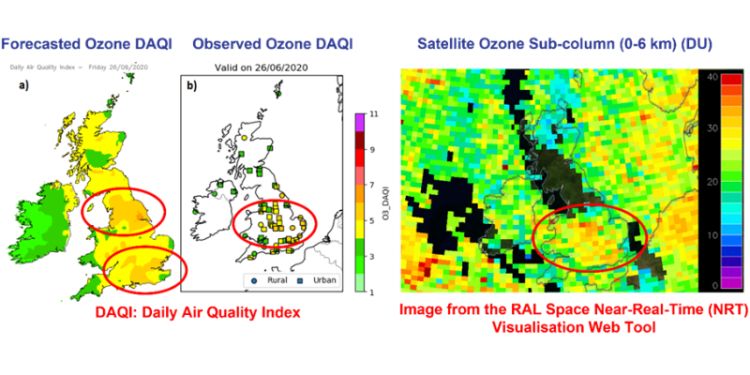
Figure 1: Example of an AQM forecast (left panel) and observations (centre panel) of the surface ozone DAQI (Levels 1-11) for the 26th June 2020 with the corresponding satellite-retrieved-ozone (0-6 km; right panel). The DAQI is a dimensionless quantity;
Figure 1 is an example for the 26th June 2020 illustrating how satellite data can provide beneficial information to help improve AQM forecasts. The predicted surface ozone DAQI has peak values in southern and northern England (left panel), while the surface observations (middle panel) show peak values in the midlands and East Anglia. However, the surface observations have limited spatial coverage. The satellite data (right panel) has near-UK coverage and shows peak ozone values in a similar region to that of the ground-based sites. Therefore, by using both satellite and surface data of ozone, the AIRSAT project can provide novel and crucial improvements to the UKMO AQM forecasts. This will benefit members of the public with air-pollution-induced health ailments and also downwind stakeholders (e.g. helping Defra and the NHS prepare for hazardous air pollution events).
Project website
https://www.ukri.org/news/nerc-funds-prestigious-knowledge-exchange-fellowships/