
Emily Dowd
- Course: PhD in Atmospheric Science
- PhD title: Detection and quantification of local methane sources using novel high-resolution satellite data
- Nationality: British
- LinkedIn: https://www.linkedin.com/in/emily-dowd
Emily Dowd is studying for a PhD on the Centre for Satellite Data in Environmental Science programme (SENSE CDT). She investigates how methane (CH4) is changing in the Earth’s atmosphere. Her primary supervisor is Dr Chris Wilson from the School of Earth and Environment; she is co-supervised by Professor Emanuel Gloor, from the School of Geography, and Professor Martyn Chipperfield, also from the School of Earth and Environment.
Emily is the University of Leeds student representative for SENSE. She explained: “I decided to apply to the SENSE CDT because the combination of the PhD project and the extensive Earth Observation (EO) training really appealed to me. I was interested in investigating how methane (CH4) is changing in our atmosphere, as well as expanding my knowledge in EO and this project was the perfect opportunity.
“The CDT also presented many opportunities to interact with a wide range of industry partners and other EO scientists which other Centre’s for Doctoral Training (CDTs) or Doctoral Training Partnerships (DTPs) didn’t seem to offer.”
Deciding to pursue a PhD
Emily decided to pursue further postgraduate study whilst working as a meteorologist. She was passionate about her research project from her integrated Masters and decided she would like to investigate her findings on a bigger scale.
Emily said: “During the final year of my integrated masters at the University of Edinburgh I decided to do my master’s project on atmospheric CH4 . The project taught me that CH4 was the second most important greenhouse gas in our atmosphere after carbon dioxide (CO2), and that there are many unanswered questions as to what could have driven the global trends of CH4 over the last 30 years.
“I have always had an interest in the atmosphere and after being a meteorologist for two years, I could not resist the opportunity to do more research on atmospheric CH4 on the SENSE CDT. I am excited to be able to take advantage of new high resolution satellite data from TROPOMI onboard Sentinel 5P to investigate one of the most important and complex greenhouse gases in our atmosphere.”
After being a meteorologist for two years, I could not resist the opportunity to do more research on atmospheric CH4 on the SENSE CDT.
Advanced data-analytics
“My project mostly involves me processing, analysing and plotting large amounts of data,” said Emily. “I work with various different types of data including surface observations, satellite measurements and model output. I also carry out experiments using simulations of the atmosphere from the TOMCAT chemical transport model to better understand the variation of atmospheric CH4 due to changes in its sources, sink and transport over time.”
CH4 levels during the pandemic
During 2020 the largest global annual increase of atmospheric CH4 on record was observed (~15ppb), Emily explained. This was a unique year due to the global pandemic and atmospheric CH4 concentrations continued to rise despite a reduction in economic activity. In 2020, as well as the preceding decades, the relative contribution of various natural and anthropogenic sources of CH4 is still not fully understood.
Emily said: “I am investigating what might have caused this large increase in atmospheric CH4 during 2020 using TROPOMI satellite observations and the TOMCAT model.
“In order to find out exactly when the large surge in atmospheric CH4 occurred in 2020, I produced visualisations of seasonal CH4 concentrations during 2020 for the TROPOMI observations (Figure 1.) and the TOMCAT model output. This highlighted that during September, October and November (SON) there were particularly high CH4 concentrations over North Africa, India, South China and North America.”
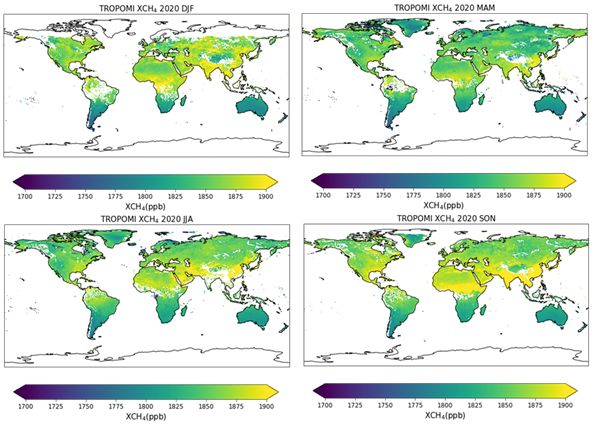
Figure 1 TROPOMI XCH4 (ppb) 2020 seasonal means for December, January, February (DJF), March, April, May (MAM), June, July, August (JJA), and September, October, November (SON).
She continued: “To find out if these high concentrations in SON were unusually high, I checked whether concentrations in these regions were increasing any faster than the mean global increase between 2019 and 2020.
“Figure 2 shows that, in particular, CH4 concentrations increased by up to 100ppb more than the global mean increase over central Africa during SON 2020. This is near a region of South Sudan that is dominated by swamps and wetlands, which are known to emit large quantities of CH4 to the atmosphere.
“The satellite data has therefore provided evidence that emissions from this region might have significantly contributed to the large global increase in 2020.”
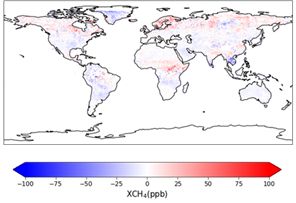
Figure 2 Difference between 2020 and 2019 SON XCH4 relative to the 2020 mean annual increase during SON.
Emily added: “We have also done a comparison of TROPOMI SON seasonal mean with TOMCAT and found differences between the two. Figure 3 shows that the source estimates that we used in TOMCAT mean that the model does not accurately reproduce the high CH4 concentrations in central Africa that were captured by TROPOMI in 2020.
“This highlights that there are still improvements that need to be made to our best estimates of the CH4 emissions from this type of wetland region in order for us to capture and understand the observed variations using our models.”
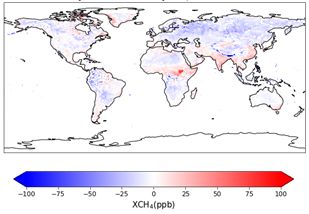
Figure 3 Difference between TROPOMI and TOMCAT 2020 SON.
Future research plans
Although Emily is at the start of her PhD journey, in the future she would like to look for opportunities that enable her to continue her research. Emily explained:
“I plan to use TOMCAT and TROPOMI to further investigate the rise in CH4 concentrations, and will develop a high-resolution nested grid for TOMCAT. This is a major part of my PhD project and it will allow us to simulate areas of interest, such as central Africa, at high resolution at a lower computational cost than increasing the global model resolution.
“At the moment TOMCAT’s highest resolution at the equator is approximately 100km x 100km whereas the resolution of TROPOMI satellite observations are 7km x 7km so the nested grid will allow for better comparisons between the satellite and model.
“Once the nested grid has been developed for TOMCAT, I will work with my CASE partner the Met Office to investigate the differences between our TOMCAT nested grid model and their high resolution atmospheric dispersion model, NAME. This will benefit the Met Office and TOMCAT research group as it will highlight improvements needed in TOMCAT and NAME.”
Join us
For more details about studying for a research degree at Leeds, visit our research degrees pages.